Reading: 0118 322 4395 | Manchester: 01617 062 414 | Oxford: 01865 479 625 | info@sharpahead.com | Office hours: Monday-Friday 9:00am - 5:30pm

 | Office hours: Monday-Friday 8:30am - 5:30pm

 | Email  | Office hours: Mon-Fri 9:00am - 5:30pm 

B2B Email Metrics Part One - The Most Important Metrics

B2B Email Metrics Part Two – The most important metrics 

By John Woods  |  August 16, 2023

I explained in part one about the Big Open Rate Lie and why that means Open Rate is a bad metric for a B2B email campaign. The good news is that there are plenty of other metrics that you can – and should – use to measure B2B email campaign performance. I’ll go through them briefly now, starting with the most important.

Email campaign metric #1: Spam Complaint Rate 

Your email campaign system should be able to tell you how many spam complaints – that is, manual complaints raised by humans, not automatic spam filters – your campaign has generated. So if for example you sent 1,000 emails and generated 1 spam complaint, your spam complaint rate (SCR) is 1/1,000=0.1%. 

In a perfect world, a compliant and ethical marketer should never get a spam complaint. All your email addresses should be correctly opted-in. And every recipient should recognise the emails you send as legitimate and valuable messages. 

In reality, one can’t avoid the occasional spam complaint. There can be misunderstandings. Or someone might end up on your email database by mistake. Or in an extreme situation a recipient might maliciously raise a spam complaint. So your SCR won’t be exactly zero. But it should be a very, very low number. I’d see an SCR even as low as 0.1% as a cause for concern. 

If your campaigns generate any significant number of spam complaints it’s likely your email campaign provider will warn you that your account might be paused or even suspended. This is because email service providers have to protect the reputation of their systems for all of their subscribers, and spam complaints harm that reputation. But don’t wait for a warning and risk a ban. Monitor every campaign send for spam complaints. If you notice any hint of an uptick in spam complaints, take some action to improve your processes and the quality of your database.

Email campaign metric #2: hard bounce rate 

Your email campaign system should tell you this number for each send. 

A “hard bounce” means you sent an email to an address that cannot receive it for some permanent reason. (This is distinct from a “soft bounce” which happens with a temporary problem, like a mail server being temporarily down for maintenance.) 

This shouldn’t happen very often, but you will naturally get a few hard bounces for a B2B email campaign. For example, perhaps a person has left their job and their corporate email address has been deactivated. 

As with spam complaints, your hard bounce rate should normally be a very small percentage – ideally 0.1% or lower. But there are some circumstances when it might be a little higher, especially if you are sending to a list that hasn’t been used in a while. 

Most email systems will automatically remove or suppress a contact that generates a hard bounce. If yours doesn’t do this, or if you are using multiple email systems (so that a hard bounce detected by one system might not be removed from the other systems’ lists), you might need to take manual steps to remove or suppress hard bounces. 

Any increase in hard bounces will often cause a warning from your email system provider, because it’s a signal of potential spamminess and bad contact list hygiene. Don’t keep sending to a list that will cause hard bounces. 

Monitor your hard bounce rate for every campaign send and take action if you see a spike. 

If you need to send to a B2B email list that’s not been used in a while, consider using a list checking service like Neverbounce to reduce the risk of excessive hard bounces.

Email campaign metric #3: unsubscribe rate
Again the unsubscribe rate for each campaign should be reported by your email campaign system. If you send, say, 1,000 emails, and two people unsubscribe, then your unsubscribe rate is 2/1,000 = 0.2%. 
Getting occasional unsubscribes from a B2B email list is a fact of marketing life. It’s not necessarily saying something is wrong. Perhaps a person has changed job role and your product is no longer relevant to them. Perhaps a person is moving to a different company and intends to resubscribe with their new corporate email address. But a high unsubscribe rate is a danger sign – perhaps your emails are too boring, or too frequent, or insufficiently targeted. 
In general I’d like to see an unsubscribe rate as a very low number, say 0.2% or lower. But there are some circumstances in which it might be a little higher. In particular if you’ve made a big change to your product or service, or if you are emailing a “cool” list that hasn’t been used for quite a while, you may see a higher level of unsubscribes at first. 
Keep an eye on unsubscribe rates and take action if you see a sustained high level or any sudden increase.
Email campaign metric #4: clickthrough rate
The clickthrough rate (CTR) is a well-named metric – it’s the number of times that a link in your email is clicked. 
Most email marketing systems will report on this number. But in some cases you might need to use a separate analytics platform (like Google Analytics) to measure it. 
There are some nuances here. For example, if the same person clicks on 5 different links in an email that you send, do you count that as 5 clicks or only 1 for the purposes of measuring CTR? Different systems will handle this in different ways. 
Clickthrough rate is a useful measure but it’s very hard to give any general guidance about a “good” CTR for B2B email campaigns. Some emails are very self-contained and informational. They don’t need to be clicked on in order to achieve their marketing objectives. Other emails are trying hard to get someone to take action by clicking on a link. In those cases, the likely CTR depends very much on the level of commitment required by the call to action – “click here to read more” is likely to get a lot more clicks than “click here to contact sales”. 
So please measure and monitor the CTRs from your B2B email campaigns, but be aware there’s no set target value for CTR. Rather you should compare CTRs from similar emails with similar calls-to-action over time. If you have a big enough email list and send to it consistently over a long period of time, differences in CTRs may help you to identify better- or worse-performing content.
Email campaign metric #5: post-click activity
If your B2B email campaign is primarily designed to get a prospect to take some action, then “post click activity” is the ultimate measure of its value. That is: when a person not only clicks on an email, but also goes on to take the desired follow-up action. This might be, for example, filling in a form to download a white paper, or booking a slot on a webinar, or asking for a sales callback. Often this activity would be considered a “conversion” of some sort. 
Some email marketing systems have facilities for tracking post-click activity (usually by adding a special tag or tracking pixel to a form completion page), but often you’ll need to use a separate analytics system like Google Analytics to track post-click activity and conversions. 
It’s important to track post-click activity but there are some caveats: 
  • If you are marketing to a niche audience, you won’t get many conversions from any given email send. That doesn’t mean your email sends are a failure! B2B sales and consideration cycles are often very long. You need to keep engaging the same audience over an extended period. 
  • Your emails have value even if a person doesn’t “convert”. Just seeing your company’s name in an email inbox, or reading some useful content in the email preview, will have a positive branding effect for many people in your list. Your email campaigns may help to convert them at a later date via a different touchpoint.
  • There are many technical limitations to tracking a person’s digital journey. Some people might see your email on one device but decide to follow up using a different device, for example. You won’t see this value attributed to the email campaign in your conversion metrics. 
So conversion and post-click email metrics are best used in a relative way – if one type of campaign gets twice as many downloads per email sent than another, it is likely to be twice as effective. Don’t rely on them as absolute measures of email ROI.
Summing it up
Email metrics are complex to understand and to use. I hope I’ve given you at least a flavour of the top priority metrics and some of the pitfalls to avoid. We’ll return to some of these themes in future blog posts.

If you have questions about B2B email metrics or need any other help with your B2B email marketing, please get in touch!
B2B Email Metrics Part One - The Big Open Rate Lie

B2B Email Metrics Part One – The Big Open Rate Lie 

By John Woods  | 
The big open rate lie 

What’s a good open rate for a B2B email campaign? 

It’s an innocent-seeming question and I hear it a lot from our clients. And I’d love to give a helpful answer. But it strikes at the heart of a dirty truth about email marketing: no one knows how many people open your emails. 

I’ll explain a bit more about why open rate is a lie in a minute. But don’t despair. There are other things that you can – and should! – measure in order to understand the performance of your B2B email marketing campaigns. I’ll cover those in a separate article.

Why email open rates can’t be measured

It’s time for the inevitable technical bit. I’ll keep this brief and skip over some details.

The systems and standards that underpin internet email date back to academic communication in the 1970s, long before there was any thought of using email for marketing purposes. Emails were plain text. Systems were designed to ensure delivery of email – that is, to make sure that the message you send gets to the recipient’s inbox. There was never any provision for finding out whether the delivered message was ever opened. Presumably it was sufficiently unusual and exciting to receive an email that one opened everything!

Skip forward to the 1990s. HTML emerged as a standard for graphical content on the web, and many email readers started to support the display of HTML emails, which could include embedded images.

Email marketers realised that these embedded images offered a sneaky way to find out whether an email had been opened. Because the image isn’t sent with the email itself, but rather it is downloaded dynamically when the email is displayed, we could detect and record these dynamic image requests. So, the logic was:

Embedded image requested => email has been rendered in an email client => email has been opened by the recipient

Count the number of image requests, and you’ll know how many opens.

(An aside: if you also add some personalised information to the embedded images, you can tell which individual recipient opens any given email. This is used in a lot of marketing automation systems. And because this approach is open to abuse, a lot of email clients will attempt to block or restrict it.)

Now the truth is that this approach was never all that reliable. People read email in lots of different ways and different email clients treat images differently. Microsoft Outlook, for example, doesn’t download images unless a user specifically asks for them. So, a person could open and read an email without generating an image request. And there are also ambiguous situations such as when the same person opens the same email on two devices – do we count that as one open, or two? So, at best “open rate” was a rough proxy for true user behaviour.

Recently the situation has become much worse with a new privacy feature from Apple “Mail Privacy Protection”. This means that emails sent to Apple devices will appear to ALWAYS be opened. The “open rate” becomes pretty much meaningless for any campaigns that are delivered to any significant number of Apple devices. It’s no longer even much use as a proxy measure.

To see why this is the case, consider this extreme example:

Campaign 1 is sent to 100 people who use Apple devices with MPP. None of them open the email. It will report an open rate of 100%. But the true open rate is. 0%.

Campaign 2 is sent to 100 people who use Outlook on a Windows desktop. All of them open the email, but with image leading turned off. It will report an open rate of 0%. But the true open rate is 100%.

That’s just about as misleading as it is possible to be! And admittedly it’s an extreme example. But it shows the underlying problem – open rate today is determined by the mix of devices and email systems that your recipients use, and not by whether they open or read your content.

Is Open Rate Dead?

“Open rate” is pretty much meaningless as a measure of email campaign performance. But it does still have a few marginal uses.: 

  • If you send a lot of very similar campaigns to the same recipients over a short amount of time, the differences between the open rates for each campaign MIGHT give you a bit of insight into relative campaign performance. This is especially true if you have a large list, where the statistics are more stable. 
  • It is worth keeping an eye on open rate because a sudden change might indicate something is wrong (e.g. an issue with deliverability). Investigate any unexplained changes in average open rate. 
  • In some special cases you might be able to segment your email statistics by device type – for example, only measure open rates by users from outlook.com. If you have a big enough list, you might be able to obtain meaningful information about user behaviour from this.
Are there any alternatives to open rate? 

I hope I’ve helped you understand why Open Rate isn’t a good measure of B2B email campaign performance. Fortunately, there are plenty of other ways to measure your B2B emails. I’ll cover them in a separate article

We help many of our clients to improve the effectiveness of their B2B email marketing. If you’d like to explore how we might help you, please get in touch!

Your GA4 B2B Reporting Care Package

Your GA4 B2B Reporting Care Package

By John Woods  |  August 1, 2023

With Universal Analytics now well on its way to live on the proverbial farm in the countryside, it’s time to get to grips with our new pet reporting system, GA4. 

If you’re new to GA4 we’ll forgive you if the reporting interface sparks a little sense of, well, bewilderment if not outright panic. It’s a big change from UA and it’s hard to get oriented.

Here are a few quick tips on B2B reporting for those new to GA4 to help ease this painful transition!

1. Bite the bullet with Explorations

Whereas you could do almost everything in UA with standard reports and perhaps a few segments, the standard reports in GA4 just don’t cover everything you’ll need. Head to the “Explore” menu and invest some time to learn the custom reporting or “Explorations” part of the GA4 system. It’s a little complex but flexible and powerful. You’ll thank us once you’ve conquered the learning curve.

2. Consider using Looker Studio for reporting

If you’re going to need to create custom reports anyway, why not create them in a more powerful and flexible reporting system?

3. Active Users is the new standard user metric

And it’s a more meaningful number than UA’s “Users” metric. Similarly look to “Engaged Sessions” as a more robust metric than the old “Sessions”. Don’t expect these numbers to exactly match your old UA metrics.

4. Beware of thresholding

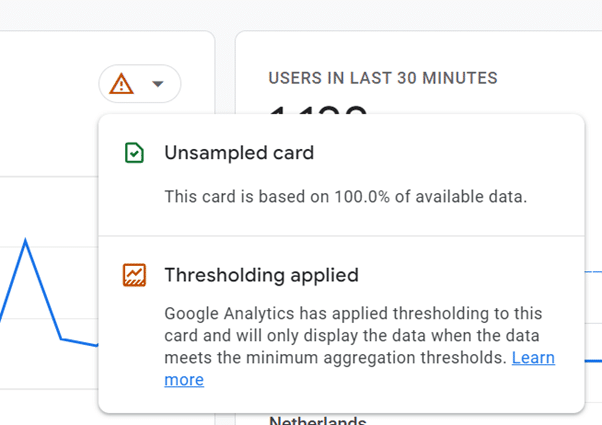
We see a lot of cases where GA4 standard reports are rendered almost meaningless because of GA4’s default “thresholding” behaviour. This happens when a small volume of data triggers a possible privacy consideration in the background of GA4. It’s easy to overlook this because GA4 switches thresholding on and off automatically depending on the data – so a given report might be impacted by thresholding on one day and not on another. You can’t turn thresholding off, but at least you can see when it is happening by watching for this little graphic:

GA4 Unsampled Card - Thresholding Applied

Thresholding is particularly problematic for B2B where we’re often dealing with small numbers of sessions – so the thresholds cut out a lot of important data. You can often use a custom Exploration to work around this. (There’s a similar issue with “sampling”, but if you’re a B2B site you are less likely to hit this issue – it kicks in when data volumes are very large.)

5. Check your data retention settings

By default, GA4 deletes granular data after 2 months. That’s not long enough if you’re working with extended B2B sales cycles. Make sure you’ve changed that setting to the maximum allowed (currently 14 months).

6. Be alert for lingering data collection setup issues

There’s a lot of complexity around the setup of the more “advanced” aspects of GA4 like ecommerce reporting and conversion events. If you can’t get the data you want out of your reports, it’s possible the data collection setup is wrong. You might not be able to fix these issues in the reporting system.

7. Consider alternatives

Google Analytics is valuable but it’s not the only measurement game in town. In our work we like to use Microsoft Clarity to complement GA4. And there are many more options that are worth considering.

If you need help with the GA4 transition or with website measurement and reporting for B2B in general, please get in touch!

Quick Win: Optimise Live Chat

Quick Win: Optimise Live Chat

By Jennifer Esty  |  July 28, 2023

In the first of our “Quick Wins” series, find out how we helped our client double the number of live chat interactions with a simple tweak.

Let’s Chat about Chat

Live Chat and Chatbots are now a staple across websites and feature in the user journey for both B2C and B2B purchases. 

Chat can reduce workload for customer support teams whilst simultaneously making it easier for prospects to get the information they need. 

However, poorly implemented or resourced chat solutions can cause frustration or disappointment for customers and prospects alike.

Small but Mighty: The Optimisation 

Our client, BeLiminal, who specialise in agile transformation and training, had been using live chat for some time. 

The intention of this optimisation was a small-scale intervention that allowed us to work quickly within the constraints of the existing live chat solution.

BeLiminal Chat Bot

The old chat

We recognised that the current chat implementation was generic, with a stock photo and default “How can we help you today?” introduction. 

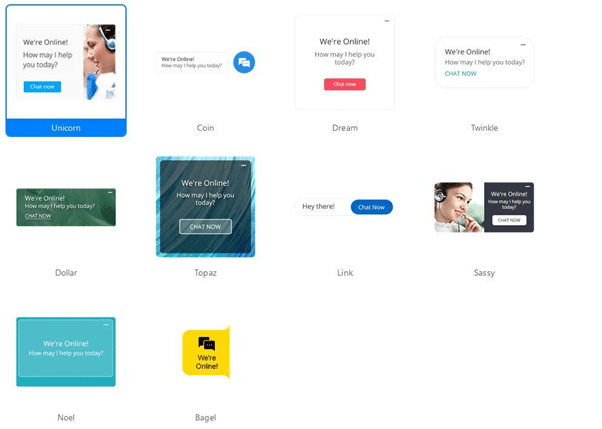
We then considered the other default options within the system:

Chat bot screengrabs

We opted for the “Topaz” option – allowing us to convey key messaging, whilst removing the need to determine an image that didn’t look authentic. 

Working within the strict character limits allowed, we settled on the solution below to individualise the chatbot:

Beliminal Chat Bot

The new chat

The Results

In the month following this small optimisation, BeLiminal doubled the number of users opting to start a chat, over half of which were valuable enquiries from qualified prospects.

The Takeaway

Simply taking a step back and looking at your chat implementation with fresh eyes could help you to make a few small tweaks which can have big results. 

For BeLiminal this is just the start of optimising their chat, with upgrades to their chat solution’s automation and tech stack on the horizon. 

If you’re looking to deploy live chat or a chatbot on your website or landing pages or want to discuss optimising your current B2B marketing setup, please get in touch and we’d be happy to help!

Google to Tweak Core Web Vitals - What do B2B Marketers Need to Know?

Google to Tweak Core Web Vitals – What do B2B Marketers Need to Know? 

By John Woods  |  July 14, 2023

Google recently announced an upcoming change to its Core Web Vitals metrics. 

It’s hard to talk about Core Web Vitals (CWV) this without resorting to a lot of Three Letter Acronyms (TLAs). So – TLA alert. Bear with me.

What is CWV? 

CWV is a Google system for measuring web page user experience. We’re fans! User experience is important and making it easier to measure helps us all make improvements. We wrote in detail about why CWV is a good thing back in 2020. 

Since the original release of CWV Google has created a new user experience metric (“INP”). INP has been available for a while in Google page speed reports, but it’s not currently one of the 3 “core” metrics that make up CWV. So INP doesn’t currently have a direct impact on SEO.

What’s Changing in CWV? 

Google’s recent announcement says that the set of 3 core metrics will be changed in March 2024. INP will become “core” and will replace an older metric (“FID”). The other two core metrics (LCP and CLS) are remaining unchanged. 

Because of this pending change, Google are sending alerts to some website owners. If you have Google Search Console (GSC) set up, you may have received a warning from Google about your site’s INP scores. 

I’ll forgive you if you’re thinking, well, WTF, at this point. NGL, this is quite an esoteric technical change. But as a B2B marketer you don’t really need to know the details.

What Do I do Next? 

The TL;DR: use Google’s Page Speed Insights tool to check your website’s INP score. Remember to check both desktop and mobile scores. If they are within the acceptable range, you don’t need to take any action. But if your INP score is bad, you should work with your website developers to improve it. Otherwise, your SEO will start to suffer from March 2024 onwards. You should expect any project to improve INP to be quite technical in nature. You’ll definitely need to involve your web developers.

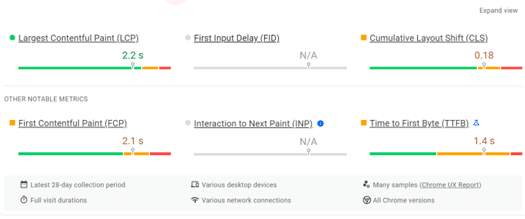
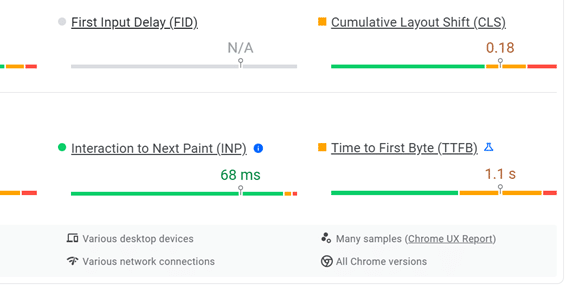
One possible complication: the CWV report in Page Speed Insights relies on real world data that Google collects from a variety of sources. If your website has very few visitors – which is often the case for niche B2B websites – PSI might not be able to give you a score for some or all of the core web vitals values. For example, here’s what we see when we test our own sharpahead.com website:

Core Web Vitals Results

In this case, the FID and INP values are both shown as “N/A” – Google doesn’t have enough data to give a score. 

If that happens for your site, you might be able to get a score by changing the CWV option from “This URL” to “Origin”:

Core Web Vitals - This URL

“This URL” tests a single page, whereas “Origin” combines all pages from your domain to give an average. In our case that’s enough to get an INP score:

Core Web Vitals Results

What If I Care About The Gory Details? 

(Feel free to skip this part!) 

FID and INP both attempt to measure website “responsiveness”, that is, how quickly a page responds to a user interaction. 

Both FID and INP are somewhat artificial measures. (That’s not surprising – user experience is complex and it’s hard to reduce it to a single measure.) Google are switching from FID to INP because they believe it gives a more accurate picture of the real user experience. 

FID is “first input delay”. It’s the time from when the user interacts with a page (e.g. when they click on a button) to when the browser STARTS to process that interaction. Note that we’re measuring something internal to the browser here – nothing has actually happened to the page that is visible to the user, it’s just that the cogs have started to turn behind the scenes. 

INP is “interaction to next paint”. That’s the time from when the user interacts with the page to when SOMETHING APPEARS ON THE SCREEN as a result of the interaction. That is: there’s a visible result of some sort in response to the user action.

I think it’s easy to see why INP is an improvement over FID. One could get a good FID score if the browser is “responsive” behind the scenes, but it might still take a long time for anything to appear on the user’s screen. With INP, the website actually has to show the response to the user quickly in order to get a good score. So INP is a more complete measure of what the user actually experiences.

The Take Home

Whether you care about the esoteric TLA details or not, it’s great to see Google refining and improving CWV.  Good user experience makes web pages more effective and helps B2B digital marketers to achieve their objectives. So, any tools that help us improve user experience are a good thing for B2B digital marketing. CWV FTW! 

If you want to hear more from us at Sharp Ahead, sign up for our email newsletter and keep an eye on our blog to stay in the loop!
If you’d like to understand more about how to improve your B2B website’s CWV scores, or if you’ve any other challenges around B2B website effectiveness and user experience, we’d love to hear from you. Why not book a call with one of our experts?

B2B Digital Rocket Fuel
straight to your inbox

Add your email address below to receive our biweekly newsletter and stay up to date with the latest B2B digital marketing news and insights.

You'll also get instant access to our growing catalogue of marketing resources.

    “An invaluable resource for getting the latest and greatest ideas and tips on B2B digital marketing. My students also benefit from the industry insights".

    Louize Clarke, Founder, The Curious Academy